The Size of the Federal Government
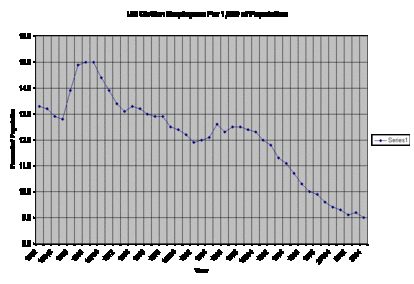
Continuing on the theme of the size of government in the face of modern complexity, this pdf spreadsheet is available from the website of the Government Printing Office. It shows that the number of civilian employees per one thousand citizens has been shrinking relatively steadily since 1969.
A graph of these figures looks like this: Sorry for the small size, but it's the largest Blogger permits. The bottom axis shows, left to right, the years 1962 - 2005. The number of Federal Civilian employees per one thousand of the total population is shown on the left axis. The scale is from 8.0, at the bottom to 16.0. at the top.
At least for the Federal Government, how are so few employees to keep their fingers, figuratively, in the dike when they are required to maintain such a growing flood of requirements.
It is easy to blame and fire a few managers or employees each time a failure becomes known. But perhaps the fault, dear Brutus, is not in our employees, but in ourselves.
A graph of these figures looks like this:
 Sorry for the small size, but it's the largest Blogger permits. The bottom axis shows, left to right, the years 1962 - 2005. The number of Federal Civilian employees per one thousand of the total population is shown on the left axis. The scale is from 8.0, at the bottom to 16.0. at the top.
At least for the Federal Government, how are so few employees to keep their fingers, figuratively, in the dike when they are required to maintain such a growing flood of requirements.
It is easy to blame and fire a few managers or employees each time a failure becomes known. But perhaps the fault, dear Brutus, is not in our employees, but in ourselves.

